We’ve previously looked at how to create a basic Process Intelligence Lens with Nintex Analytics. Let’s take it to the next level. The best thing is, anyone can do it!
We are going to show how to get the data you need and feed it into a place where you can do something with it. And we will do it so the data is always current with the click of a button.
We know there are three options when you create a new Lens. One is creating an “OData Connection.” In fact, you can return to any Lens you have previously created and select this option (available below the dashboard).
When you click the “OData Connection” option, the screen below will appear with a list of OData links. This list provides different data sets related to the Lens as per the OData type label.

Take the top link “Domain details” as a catch-all for the data sets (i.e. all of those data sets listed, together). Hit “copy URL to clipboard” and you’re ready to unleash!
This OData URL is your key to plugging the data surfaced in Analytics into any analytics tool you use… it could be excel, it could be Power BI… it doesn’t matter – what does matter is how easy it is – no queries, no cubes, no manual extraction.
Note: Nintex Analyticsuses the latest OData connection (V4), so the analytics tool you want, needs to accept this version.

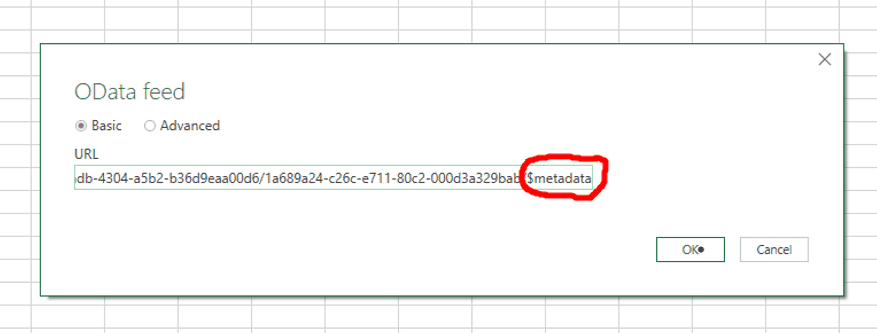
A box will appear like the one below. Paste the OData URL link. There is a catch, you will need to remove the “/$metadata” at the end of the link for it to work. Once you remove it, hit “OK”.

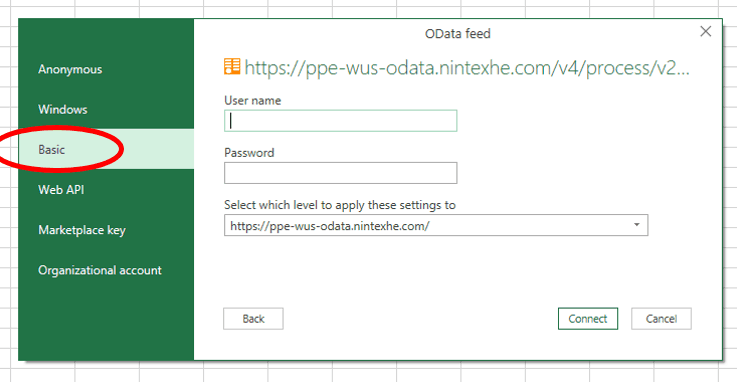
Next, enter your Nintex Analytics credentials, to verify use of this data. Click on “Basic” and use your Nintex Analytics User Name and Password. Be sure to use the dropdown menu here and match the OData URL exactly to the “level to apply these settings to.”

All of those data sets from the Nintex Analytics pop up. Select the data sets you want and hit “Load.” Note the more data sets you select, the longer time it will take to load.
Voilà – Your Nintex data is now feeding into the spreadsheet and you can really put your excel skills to use. What’s even better – the OData feed can be refreshed in Excel whenever you need to.
OData Link into Power BI Desktop
Open, Power BI Desktop, if you don’t have it, you can download it here for free. When you get to the initial welcome screen (below) – select “Get Data.”

Then select where you want to get the data from. Scroll the list of options and hit “Odata Feed.”

Again similar to the Excel example, paste the OData URL in the box that appears and then select “Basic” to enter your credentials (be sure to remove “/$metadata” from the link) and hit “OK”.
Choose the data sets you want to use in Power BI and select “Load.”

Once the data is loaded, it is live. You can now leverage the powerful visualizations in Power BI to create custom graphs with your data. To learn more about the basics of Power BI check out these resources.
If you haven’t yet, go and try it for yourself.
Visit the Nintex Community today to learn more and engage in conversations with fellow Nintex users!


